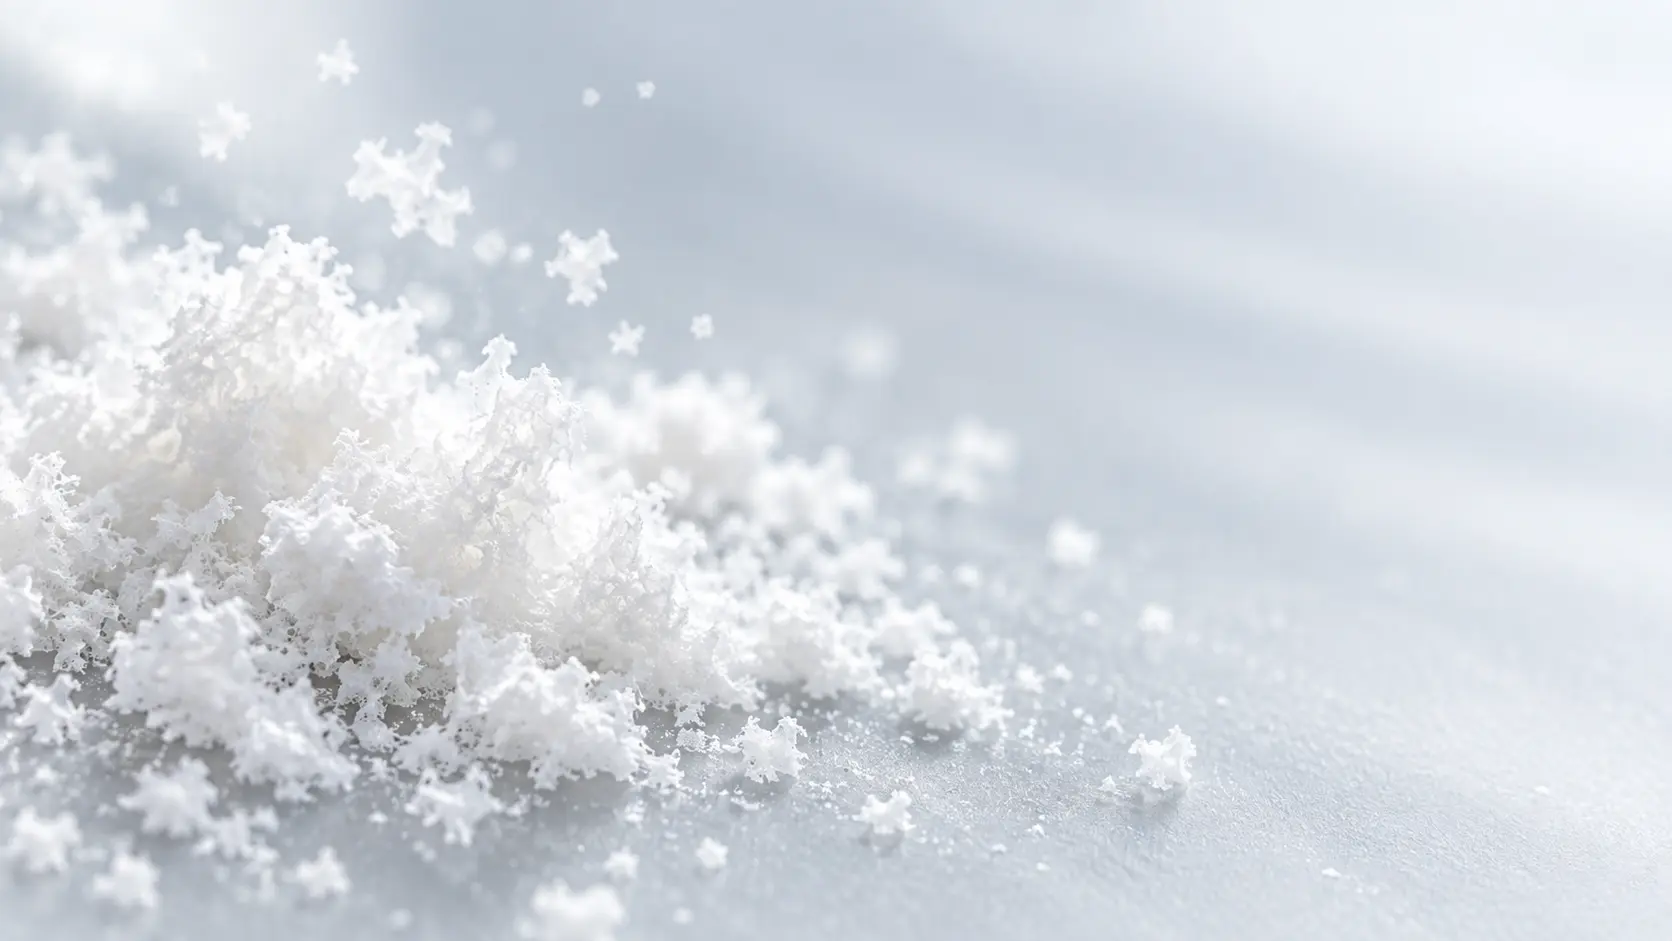

A plume of ultrafine white silica forming a flower-like shape

Technology capability

From material insight
to repeatable production.

More than twenty years of process experience and a joint laboratory with Zhejiang University support quartz purification and nano silica development. Trials, analytical results and production feedback guide scale-up.

Explore the signature process
20+ years of core-team process experience2,000+ quartz resources studied59 patents across Jingui and associated group companies

Measured evidence

Every technical decision returns to data.

Compare raw ore, process intermediates and finished materials through elemental analysis, particle-size measurement and application tests. The results guide feedstock selection, purification and milling conditions.

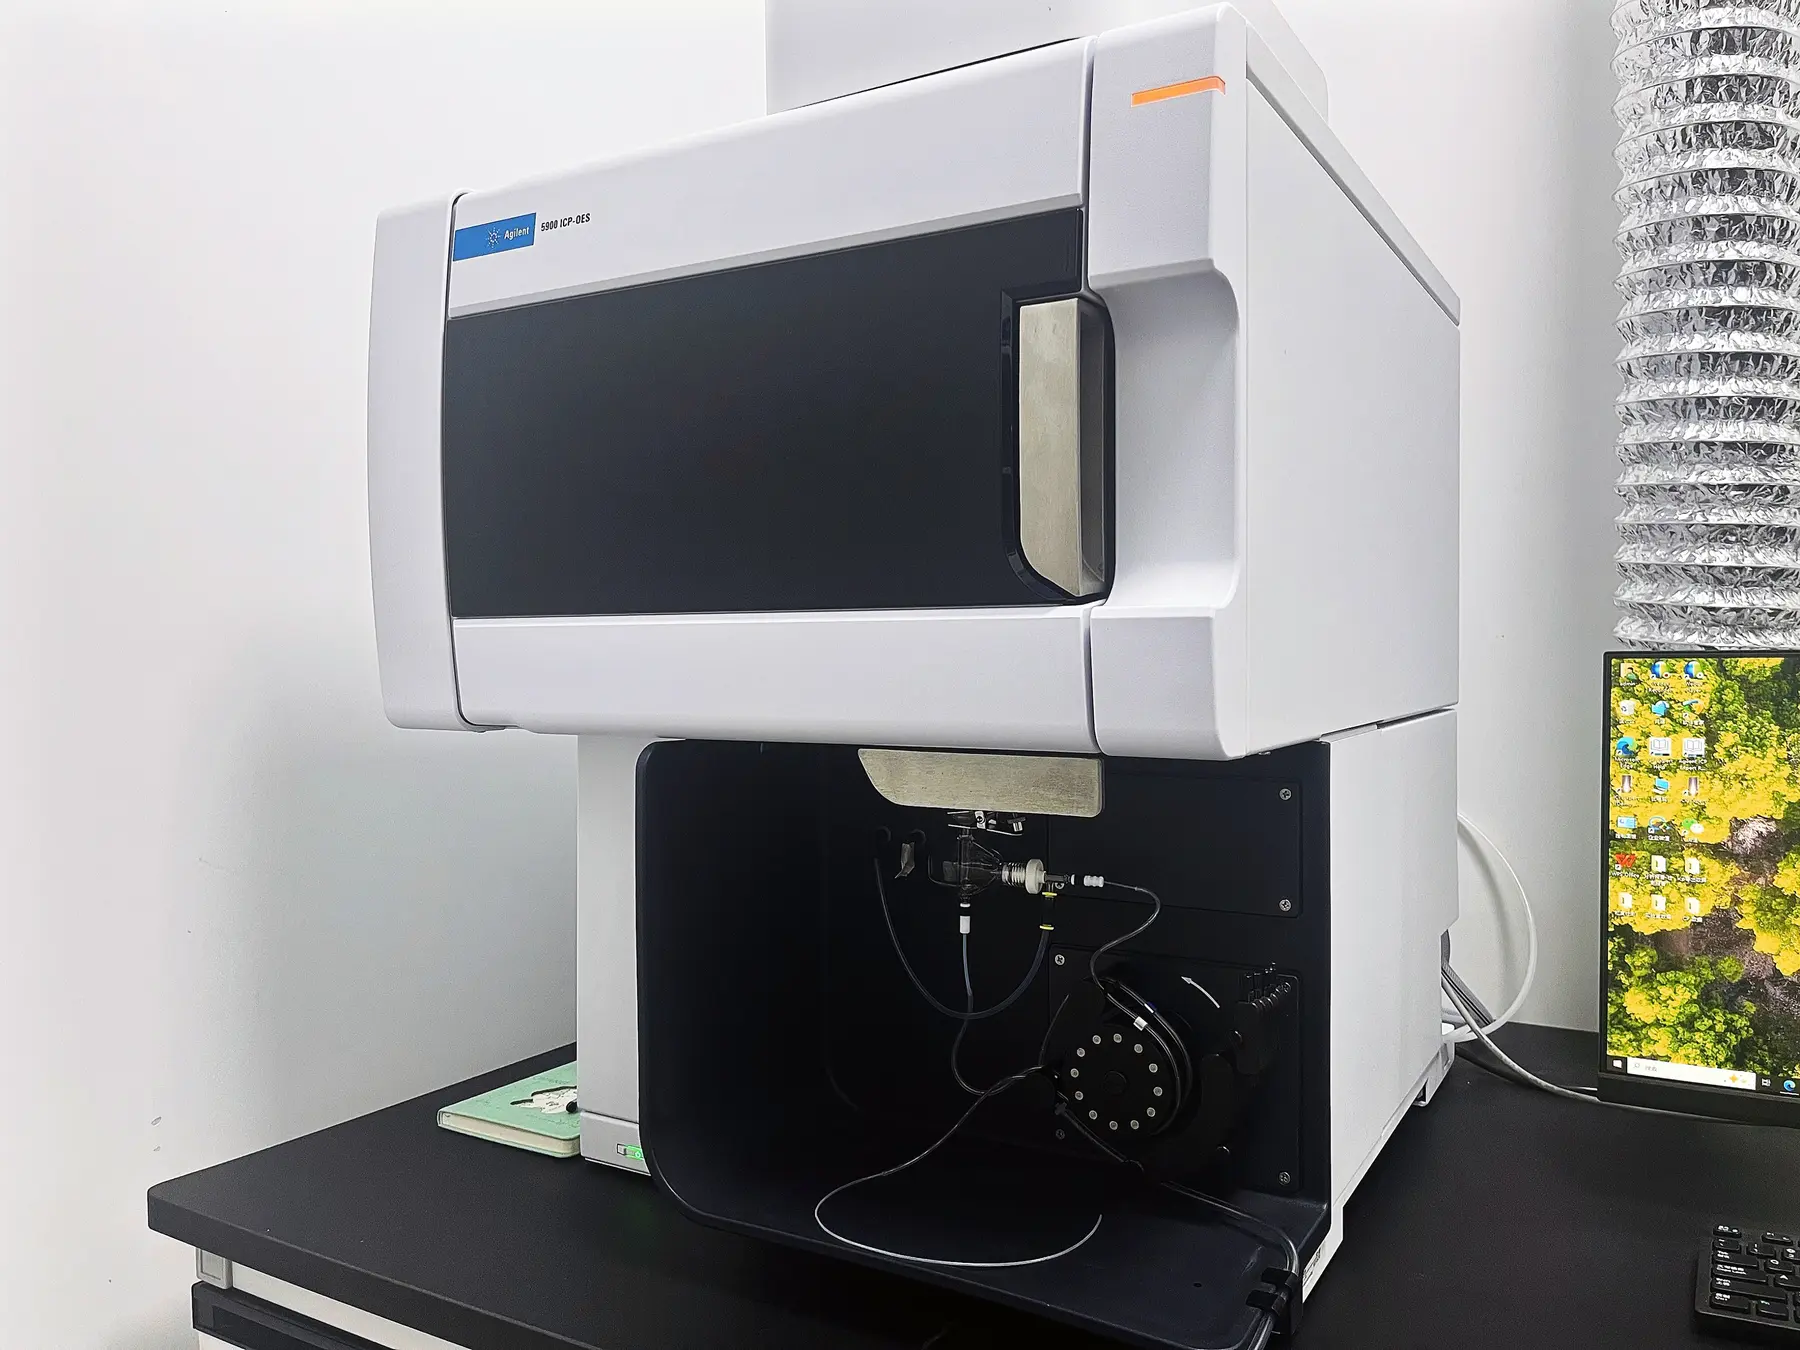
ICP-OES instrument in Jingui's analytical laboratory
ICP-OES · laboratory analytical capability
01 / Laboratory capability

Measure trace impurities before they become a process problem.

The Agilent 5900 ICP-OES is used to measure elemental content in quartz materials. The current analytical workflow covers 13 trace elements—including Fe, Ti, Al and Li—and supports ppm-level impurity evaluation. Reporting limits are confirmed for each element, sample matrix and test method.

13trace elementsppm levelquartz impurity evaluation
  1. 01Receive & registerRecord sample identity, batch and testing target.
  2. 02Representative samplingSplit and prepare a representative test portion.
  3. 03Sample preparationDry, grind or digest according to the selected method.
  4. 04Trace-element analysisMeasure the agreed impurity elements by ICP-OES.
  5. 05Review & reportVerify the data and issue a batch-linked result.
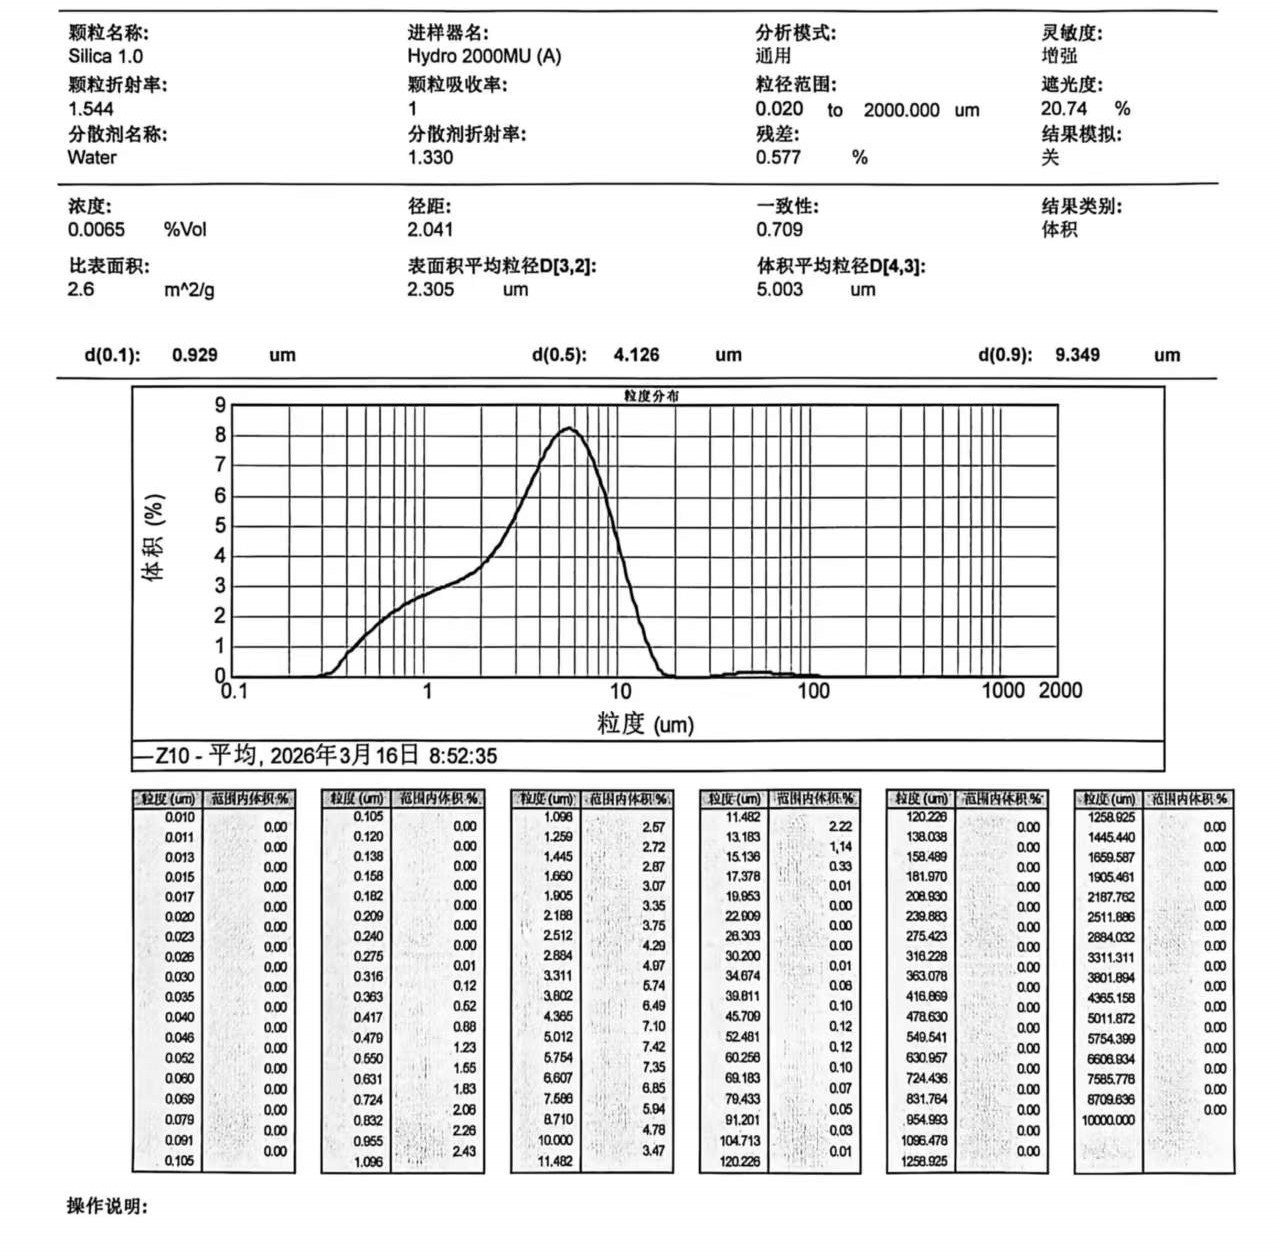
Complete Mastersizer particle-size distribution report showing D10 0.929 micrometres, D50 4.126 micrometres and D90 9.349 micrometres
Mastersizer · representative particle-distribution record
02 / Particle distribution

Particle control is a distribution—not one nominal size.

D10, D50 and D90 describe the fine end, median and coarse end of a particle population. This is more useful than a single mesh designation because distribution affects packing, dispersion, melting behaviour and the stability of a customer's process.

0.929 μmRepresentative D104.126 μmRepresentative D509.349 μmRepresentative D90

The complete curve is used to adjust milling and classification conditions and to verify that repeated batches remain within the agreed particle window.

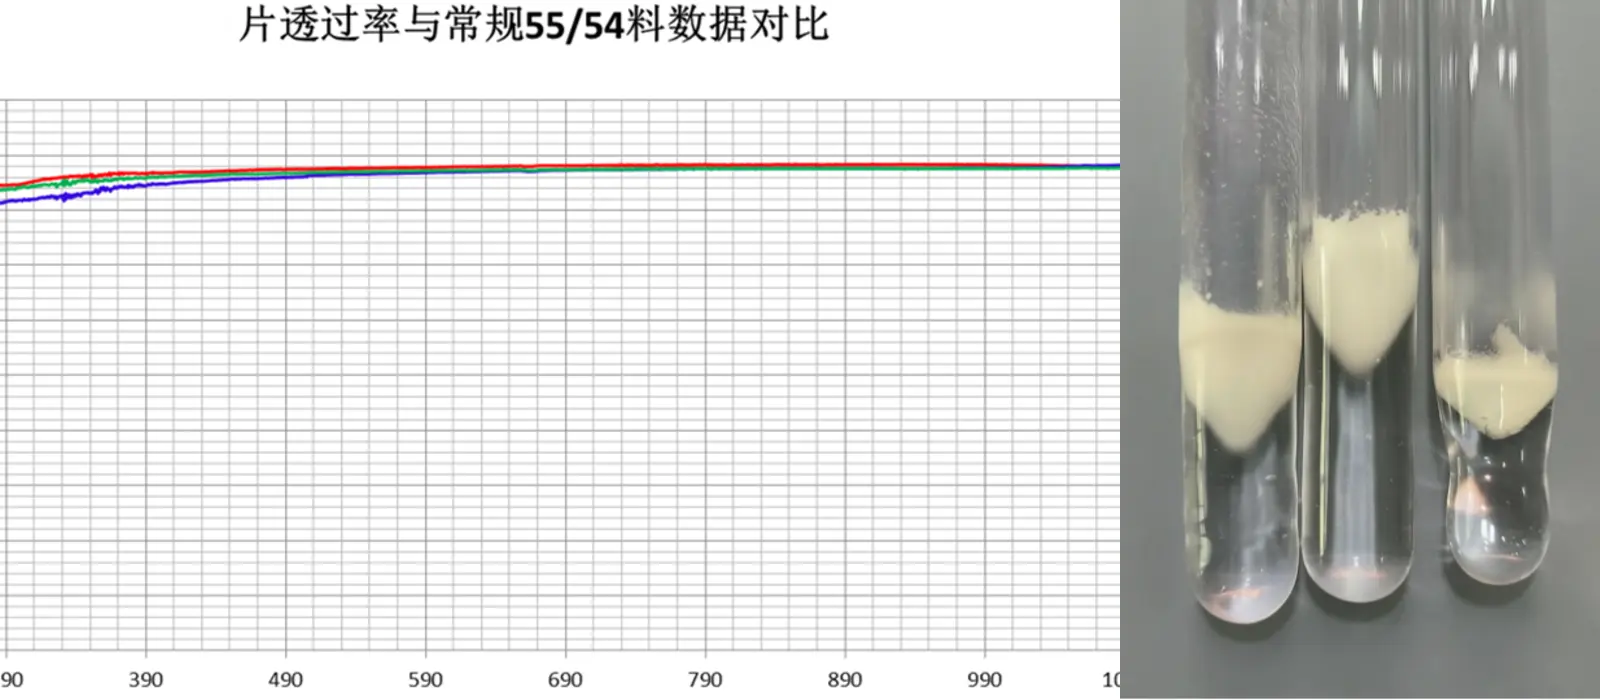
Complete optical transmission comparison and quartz melting observation used for application verification
Transmission comparison & melting observation
03 / Performance verification

Verify what the material does after processing.

Chemical purity and particle data explain only part of performance. Optical-transmission comparison and controlled melting observations help show how a material responds after it enters a downstream process.

  • Optical responseCompare transmission behaviour across the measured wavelength range.
  • Melting observationObserve the condition and appearance of samples after controlled heating.
  • Material comparisonConnect changes in the material route with differences in downstream performance.
Explore testing services

From breakthrough to volume production

Two production routes prove two different kinds of control.

High-purity quartz development focuses on impurity removal and contamination control. Nano silica development uses plasma deflagration, followed by collection, deagglomeration and classification to control particle characteristics.

Jingui produces 6N crystalline quartz sand and nano silica powder. Purity and particle specifications are evaluated separately for each product.
01 / Natural quartz purification6N

Ultra-pure quartz sand at production scale

The route begins with the mineral itself. Ore evaluation, targeted impurity removal, contamination isolation and batch testing are linked into one controlled process, connecting selected quartz feedstock with repeatable ultra-pure production.

Finished-sand test records are available on the high-purity quartz page.
02 / Plasma particle engineeringNANO

Nano silica powder for volume production

Plasma deflagration produces the silica intermediate. Subsequent collection, deagglomeration and classification prepare the powder for chemistry and particle-size verification before release.

Capability focus · nanoscale particle formation, agglomeration control and repeatable final distribution.
Milling, classification and contamination control

Batch or continuous ball milling is paired with air classification for the appropriate powder route. Coarse material returns for regrinding. Ceramic contact surfaces, magnetic separation and batch testing help control wear-related contamination; equipment and lining materials are selected for the target impurity specification.

High-purity quartz sand Nano silica powder
Process intermediateSilica BloomSilica Bloom is the light, flower-like intermediate formed during plasma deflagration. Its open, hollow appearance describes this process stage, not the internal structure of the final powder particles.

Plasma deflagration

A visible intermediate in the nano-silica process.

Plasma deflagration produces a loose, flower-like silica intermediate. Collection, deagglomeration and classification follow, with chemistry and particle characteristics verified on the finished nano silica powder.

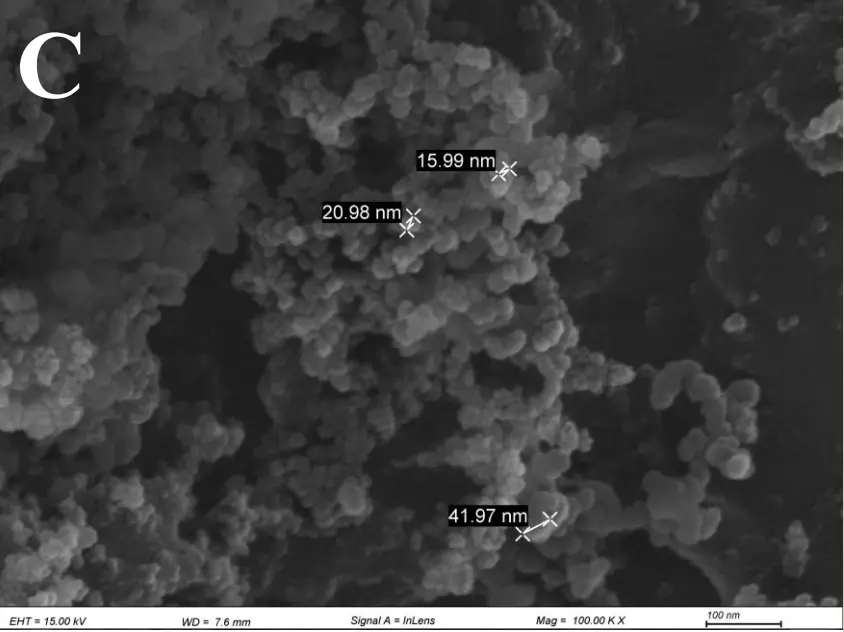
SEM image of nanoscale silica with measured features from 15.99 to 41.97 nanometres
SEM · representative morphology
Representative purity≥99.999%
Reported total impurities<4.47 ppm
Observed SEM features15.99–41.97 nm
Representative nano silica data. SEM feature measurements do not describe the entire batch distribution or prove hollow final particles. Specifications and test methods are confirmed by grade.

Start a technical review

Start with the sample, the target or the process problem.

Share the feedstock, required chemistry, particle window and application. We will align the relevant testing and development route.

Request a technical review